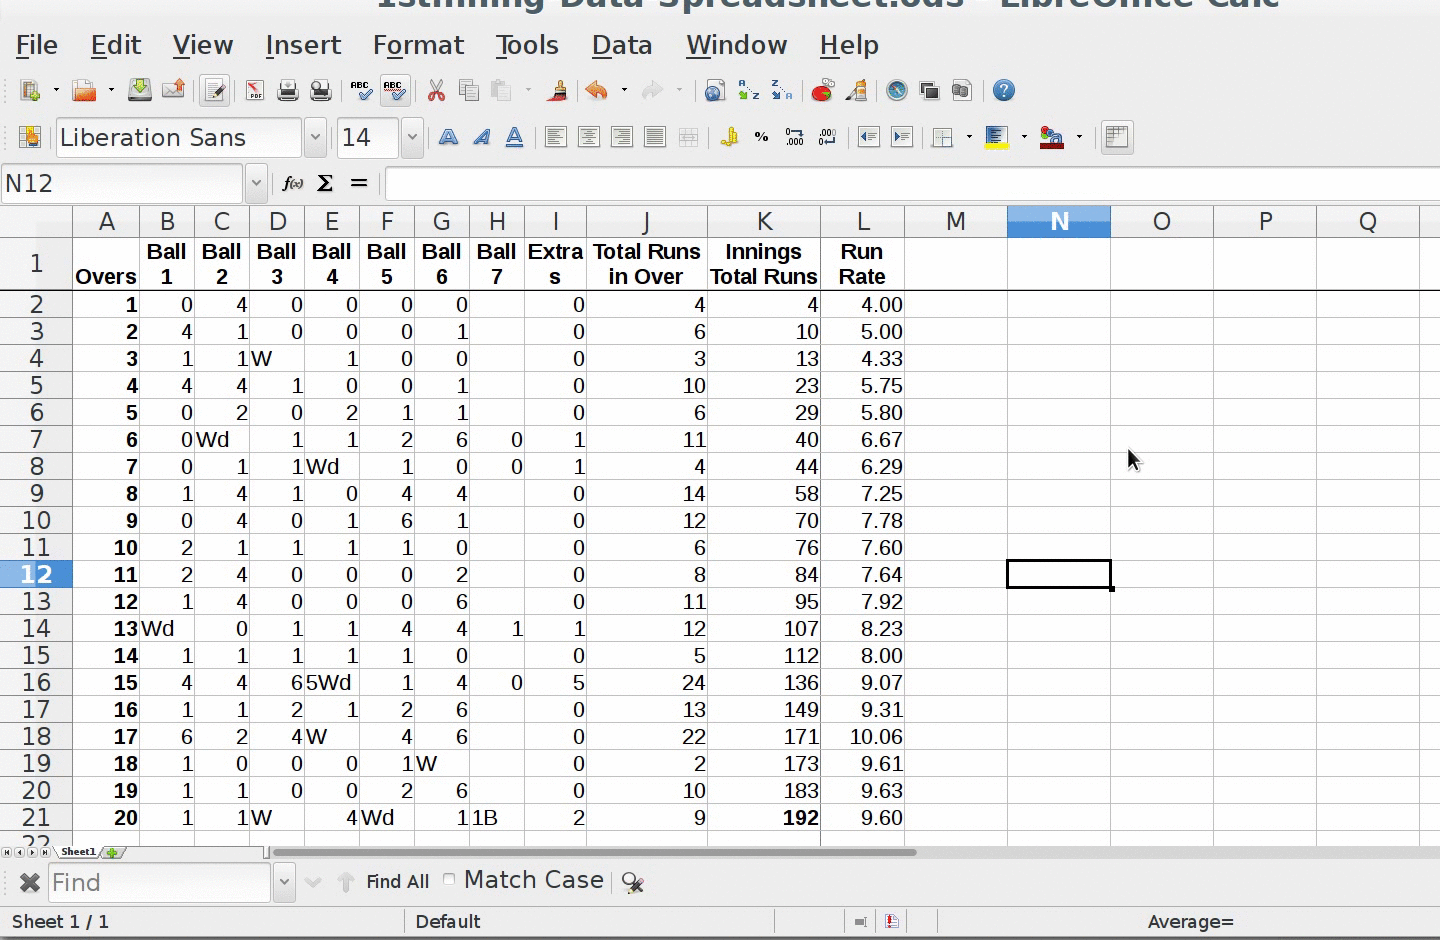
Creating line graph for run rate:
- Line graphs represents data in a line format
- Line graphs are widely used to display relation between two categories of data.
- For drawing line graph against run rate, select the run rate column first.
- Then repeat the same procedure as done for drawing column chart.
- In chart type block, select option as "Line" chart.
- We can select any pattern of line chart that we think most suitable for presenting data.
[Contributed by administrator on 15. März 2018 15:06:44]