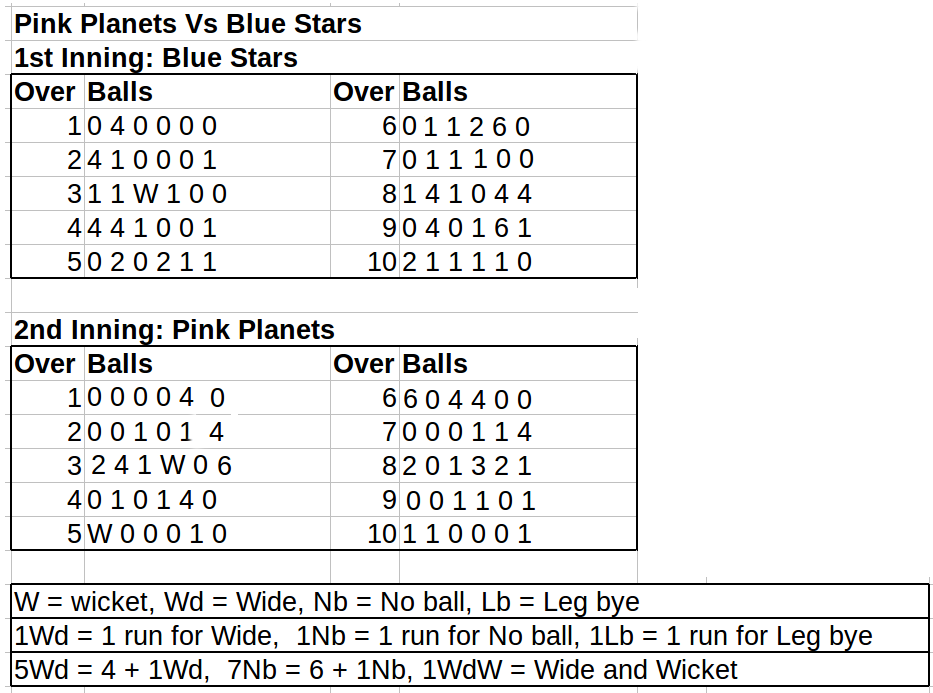
- We have raw data of the T10 cricket match.
- This data needs to be organized in a way that will help us in simplifying analysis of the data.
- Which will also help in doing statistical processing such as runs per over, average runs per over, total runs etc.
- For keeping data into tabular format i.e. row and columns format from given details, we firstly have to figure out the quantities, against which we can map the given data.
- Here in the T10 commentary data, we can put the runs against each ball in the over.
- So in this activity we will look at the given raw commentary data and tabulate that data into spreadsheet.
[Contributed by administrator on 15. März 2018 15:01:14]