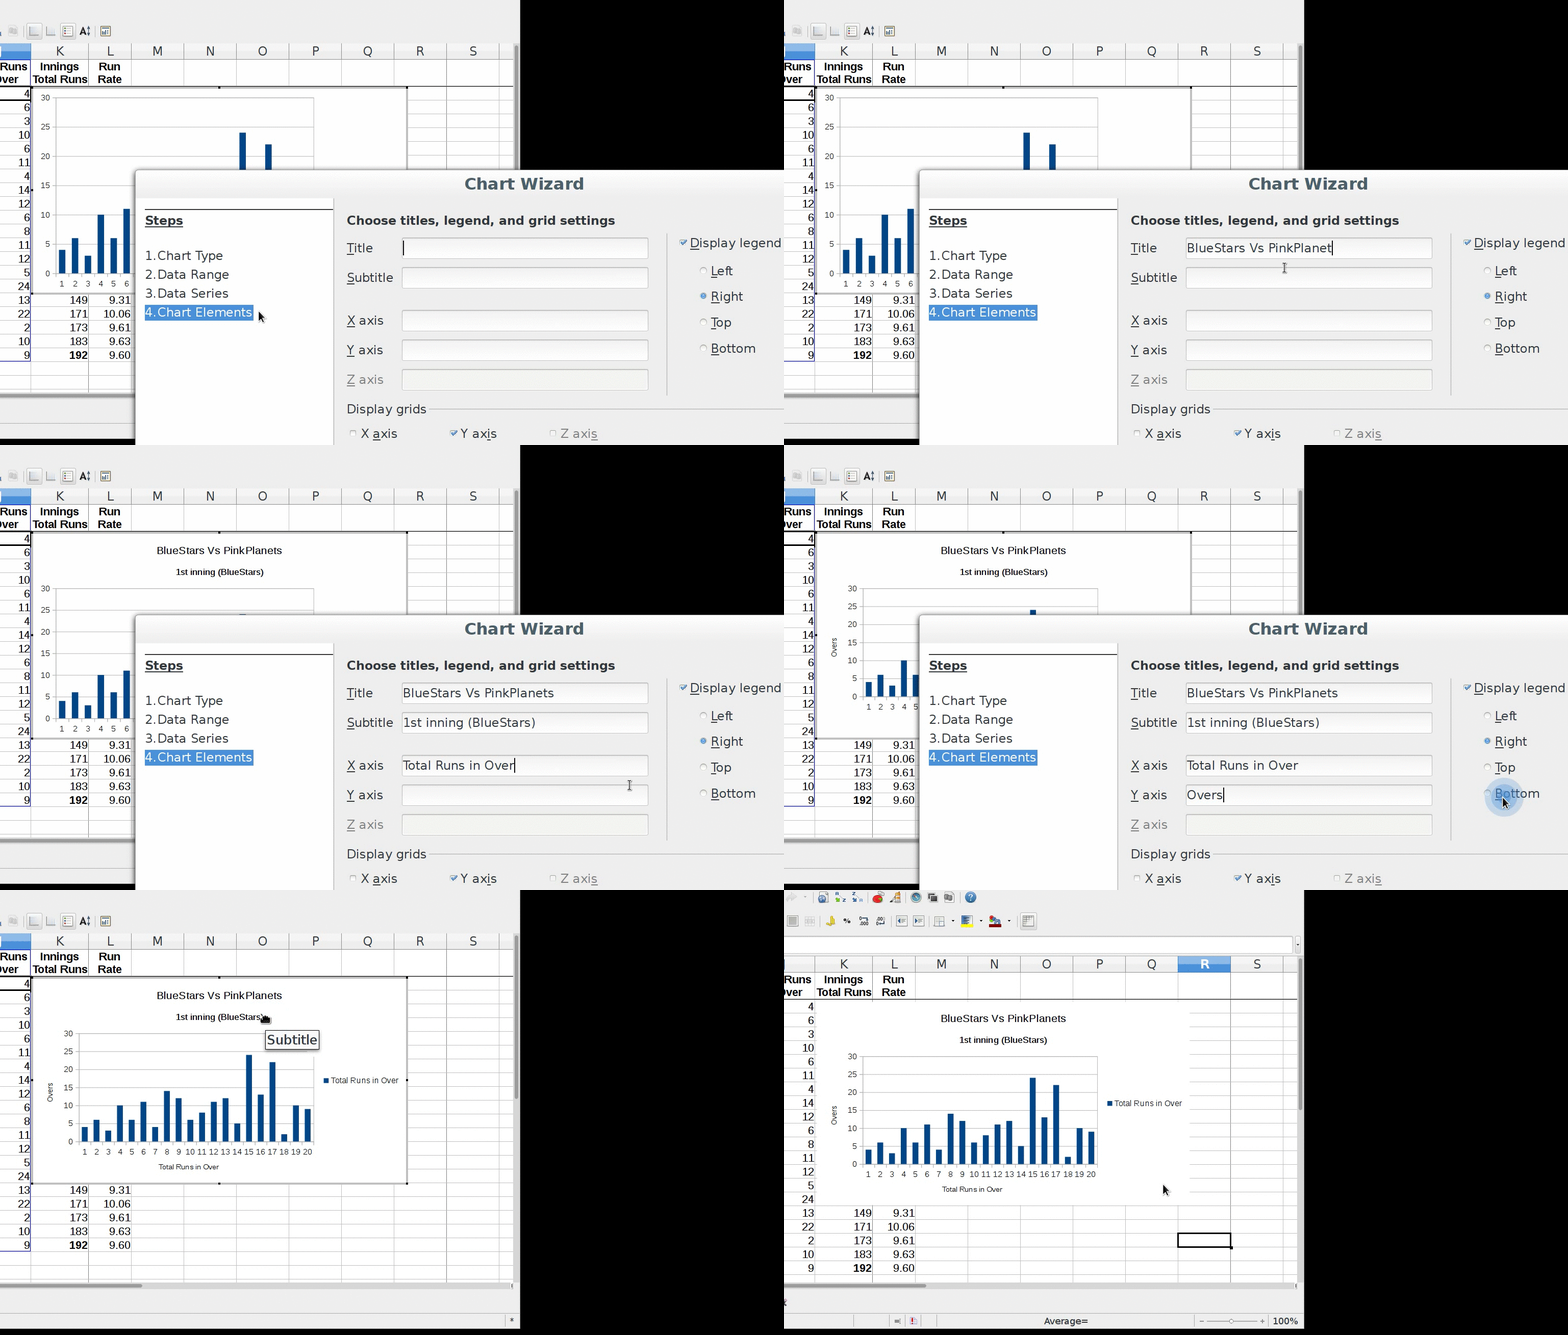
Chart Elements:
- In chart elements, we get options for:
- Giving title, subtitle for chart
- Giving labels for axis
- Display or Hide grid for axis
- Display or Hide Legend, if display then its position on chart
- These are 4 major steps that we can follow to display full detailed graph for selected data.
- Though we can create graphs by taking default settings as we done here, but it is good practice to specify Chart elements on chart.
- Other settings are required as per the arranged data and its presentation.

[Contributed by administrator on 15. März 2018 15:06:26]